How to Protect an Exploit: Detecting PageHeap
Introduction
Welcome back to this pretty much abandoned blog. If you don’t know me, I’ve been involved in exploit for some time before switching to a much less offensive job.
Yes, you read right, this is about protecting the exploit and not protecting from the exploit.
I always had these ideas on how to improve the exploits to the next level, not only during exploitation but also before and after executing it. I’ve written before (7 years already wow!) about process continuation and I’m pretty sure it is being widely used in exploits since ages, earlier than my post. The problem is that many of this techniques remain in the shadows because they are not used in the exploit show offs.
This time, I’m writing a series of blogs on how to protect an exploit from executing in an environment where it might not succeed. The wild is a dangerous place and lot of hackers have lost exploits to it.
In this specific series of posts on how to protect an exploit, I’ll explore different methods to detect if the program we are attacking, in this case a browser, is being analyzed with some kind of tool so we can abort the exploitation instead of failing, crashing, and being detected.
Why?
Exploits are valuable assets so the most logical thing is that you want to keep them for as long as possible. In addition, most of the time you don’t want to be found using one. But for that to happen you need your exploit to go undetected.
The exploits found in the wild are first detected because of four main reasons:
- Re-used parts of other exploits so they triggered some signature in detection products
- Crashed because it was unreliable and was analyzed later
- Crashed because the program is being monitored and was analyzed (honeypot?)
- You shared the exploit with a friend who tried to hack his/her ex
Because we are focusing on the third one, our first guest will be PageHeap.
How PageHeap works?
PageHeap is a Windows tool included in the SDK/WDK which concept is to detect memory corruptions in the process heap as soon as possible.
To accomplish this, it replaces the heap allocator with another one. This allocator will make every allocation through VirtualAlloc making it return at least a page in size (4Kb in most systems).
But not only that, the returned address will point to the end of the page minus the requested size. Therefore, making any heap buffer overflow hit the end of the page.
This also prevents many widely used techniques that depend on an specific heap layout for arranging allocations in an specific way. Sometimes of the name of Heap Massaging, Heap Feng Shui or others (probably created for some BlackHat talk).
So, PageHeap breaks the preconcept of how the Heap works that, as described before, will make most of the exploits relying in any kind of heap layout crash.
If it’s the first time you read about PageHeap, you might want to google more about it as it’s a very handy tool for debugging.
How to detect PageHeap?
The main difference of a program behavior under PageHeap is that the heap allocations will be a lot slower no matter what the size is. Remember that heaps are optimized for allocating all kind of different object sizes as fast as possible.
Instead, with PageHeap, each allocation is requested to the kernel through VirtualAlloc which involves a context switch and processing it in the kernel. The time spent memsetting the memory before returning it is very short compared to the time it takes the rest of the allocation process.
As a consequence, a small allocation and a big one will be closer in time than with a normal heap if the big one always requires VirtualAlloc.
This time measurements can be detected thanks to the window.performance.now() counter available in most JavaScript engines and has a precision of micro-seconds (it’s reduced in some browsers because it can be abused for a big family of timing attacks, specially the ones involving TLB).
Because Chrome and Firefox have their own allocator, enabling PageHeap won’t change much (remember that it hijacks the original malloc/free functions). In this post we will target the two other browsers that use the default allocator in Windows: IE11 and Edge.
Looking for functions which allocate different amount of bytes, I came across the Uint8Array which is a TypedArray using an ArrayBuffer underneath.
It’s used like var buf = new Uint8Array(len). And from tracing the function, both IE and Edge, when create the ArrayBuffer, will directly call msvcrt!malloc with the value we specify. What a catch!
For the small and big values, I will be using 0x10 and 0x1000 respectively because the big one will always trigger a call to VirtualAlloc. The method I will use is try to allocate as many Uin8Array as possible in 20ms for both small and big allocations.
Ok, enough, show me the code!
function doFor(fun, time) {
    var i = 0;
    var store = new Array();
    var startTime = performance.now();
    do {
        for(var j=0; j<100; j++)
            store.push(fun());
        i++;
    } while((performance.now() - startTime) < time);
    return i;
}

function allocPageBA() {
    return new Uint8Array(0x1000);
}

function allocSmallBA() {
    return new Uint8Array(0x10);
}

var bigRet = doFor(allocPageBA, ALLOC_TIME);
var smallRet = doFor(allocSmallBA, ALLOC_TIME);

alert(bigRet);
alert(smallRet);
Now, this is a little inconvenient because we are introducing other allocations while we measure allocations.
To resolve that piece of error-inducing code, I created an object that will pre-allocate an Array and then will store the objects in there thus no generating new allocations.
Also, realize that I’m saving the objects allocated to prevent the garbage collector to kick in and free them which would introduce another error in the measurements.
function NoAllocStore(count) {
    this.count = count;
    this.array = new Array(count);
    for(var i=0; i<count; i++) {
        this.array[i] = 0x41414141;
    }
    this.index = 0;
}

NoAllocStore.prototype.store = function(obj) {
    if (this.index >= this.count) {
         alert("bad");
         throw false;
    }
    this.array[this.index] = obj;
    this.index++;
}
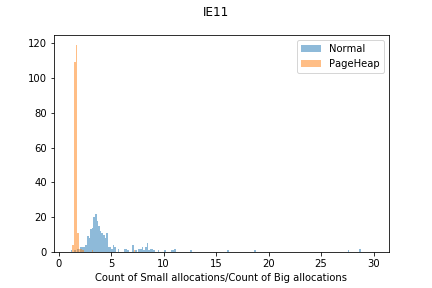
The final code is here. I ran it a few times (250 to be exactly) and compared the distribution of what I got in both browsers with PageHeap disabled and enabled.
The distributions I got in IE11 was:

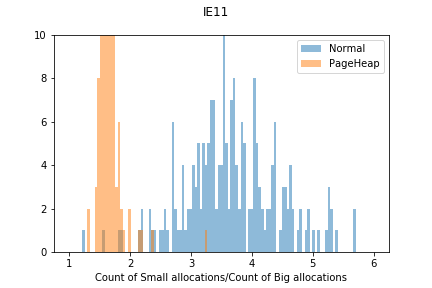
In more detail to see when the distributions start mixing:

It’s very visible that the PageHeap-enabled one has a more dense distribution and hence, is more deterministic on the time of allocations. It can be attributed to the page allocation being much more time-expensive than the heap, making other parts of the code less influential on the overall time.
As homework, fellow hacker, you might want to measure the number of total instructions executed (ring0 and ring3) after each malloc call using a system emulator or debugger.
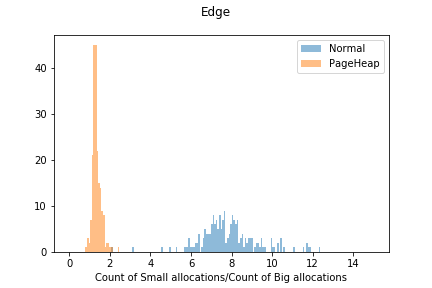
For Edge, the distributions are very similar but you can notice that they are much more separated and 3x is a conservative and very good number to draw the line at:

I will set the limit at 2x for IE and 3x for Edge, and anything under this limit will be classified as PageHeap enabled. The other cases will be assumed safe for execution.
You can check your IE or Edge browser with this file detect.html and ping me back if you are getting different results. Also, if you are interested, the code used for retrieving and analysing the data is at https://github.com/snf/exploit/tree/master/anomalies/pageheap.
Conclusion
It has been demonstrated that with 40ms, you can make a quick exercise to analyze if PageHeap is present and if it’s worth continuing with the exploit or not.
Thanks for reading, if you have any extra information or know of a better method, please let me know. Also stay tuned for future posts on detecting other tools.
- Follow me in Twitter: @snfernandez
- Contact me at Gmail: sebanfernandez
- Secure is better: GPG Key
Warranties
This is an experiment and by no means you should trust it without running further tests under different cpus and virtualization technologies. Remember this is one of those ItWorksInMyPC(TM) projects.
I take no blame if your exploit is executed by a honeypot, the bug patched and you make the news for APTing people.